Example - Tracking stock investments
Starting on November 2nd, 2010, we've added a simple feature(Quantity for transactions) allowing users to track stock investments, inventory, or time based billings.
What this feature does is simply allowing user to assign a quantity to every transaction. In the following example, we designed a stock portfolio scenario to illustrate how it can be easily tracked.
Feature offers
This feature offers a few distinctive and helpful functions, after learning this example, user should be able to:
- 1) Record buying and selling stock transactions with quantity as shares.
- 2) Check current cash balance in stock account.
- 3) List of all the stocks and their amounts, shares, and unit prices to break even.
- 4) List of all buying and selling stock transactions, the buying/selling quantity and prices(unit price as well).
- 5) List of specific stock transactions, the buying/selling quantity and prices(unit price as well).
- 6) Group stocks in any manageable way.
This example assumes user has basic knowledge of how to use all the basic functions. Please refer to http://www.accpal.com/learn/ to learn the other features.
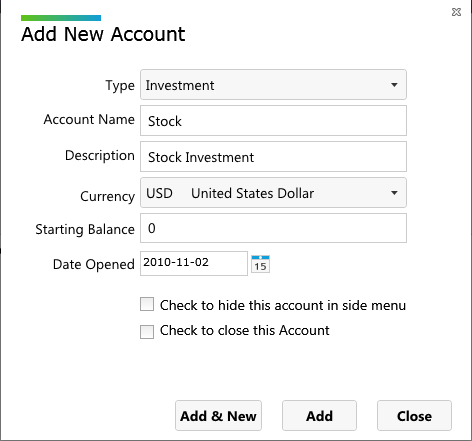
Let's start by opening a stock account, this is the account we'll be using to buy and sell stocks:
We'll be using tags to track the stocks we buy or sell. Let's add a few companies that we will be buying and selling:
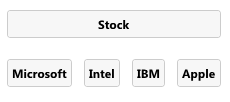
and that' all we need to get started tracking stocks.
Initial deposit
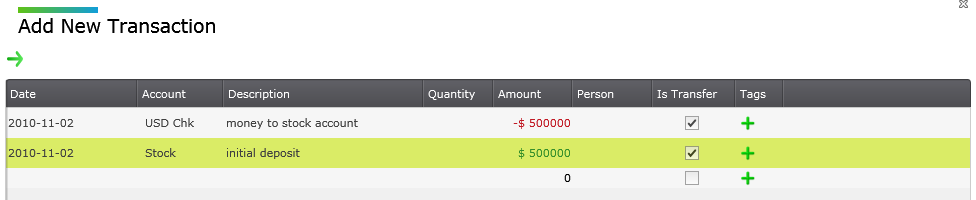
When we first open our stock account, it doesn't have any money, so we make an initial deposit($500,000.00) from our other bank account, "is Transfer" is checked to indicate that this is a money transfer between accounts:
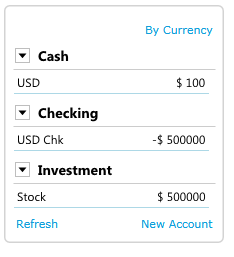
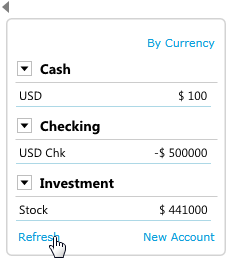
Click refresh on the account summary, we should be able to see the balance updated:
Recording stock transactions
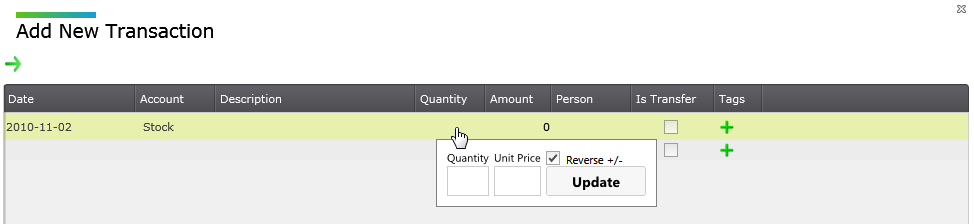
Now we may start record buying and selling stock transactions just as we normally would, to enter the quantity, move the mouse to blank quantity of the specific row, where the hand sign cursor is shown, click on it, we will get the following screen for us to enter quantity and unit price(optional):
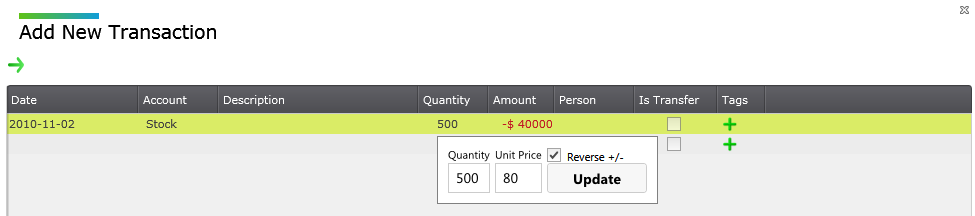
By default, adding quantity(positive value) will decrease our money, since we have to pay money to buy. As a result, for 500 share, $80 per share, we will end up having the following (-$40000) result. We can uncheck the "Reverse +/-" to change this behavior:
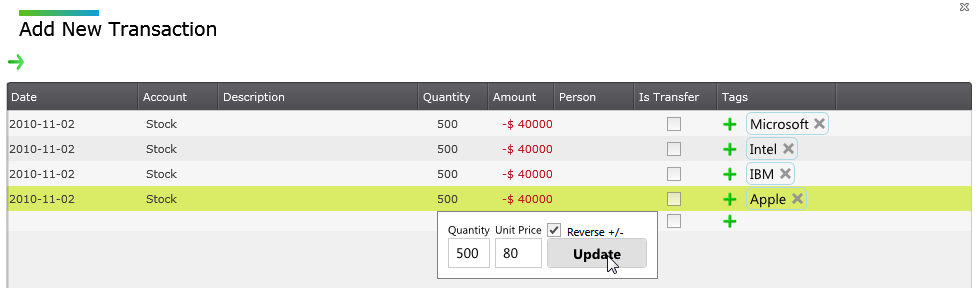
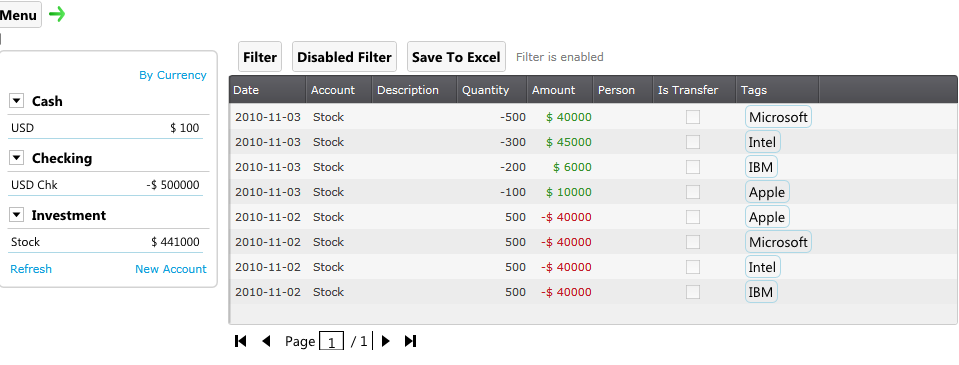
Let's say we buy 500 shares of each of the following companies, assuming each share costs $80, we would have the following result:
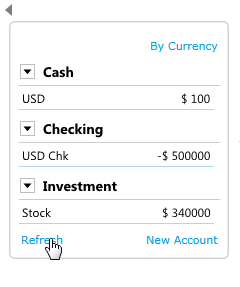
We've spent a total amount of $160,000 on buying the above stocks. Click refresh on account summary, we should see that the stock account now has a remaining balance of $340000.00, this will allow us to know exactly how much money is left in our account:
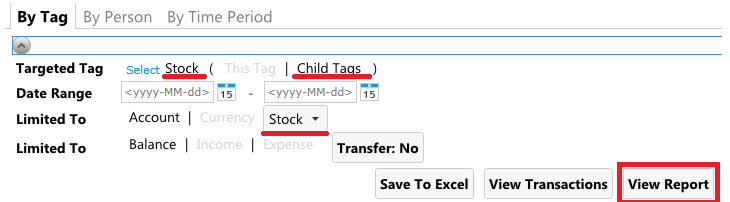
Let's try to use reports to find out more information about stock details, we select "Stock" as targetted tag, make sure "Child Tags" is chosen, set the account to "Stock", and click view report:
We should be able to see the following information, 500 quantity, unit price of -80, makes up an amount of -$40000 for each company, representing the amount of money we spent on that company:
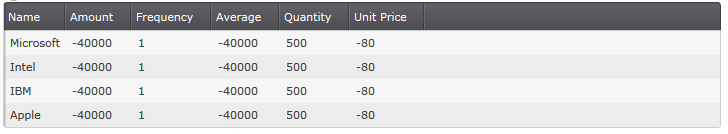
Note that Frequency means the number of transactions, Average means the average amount per frequency, which is not useful in this example.
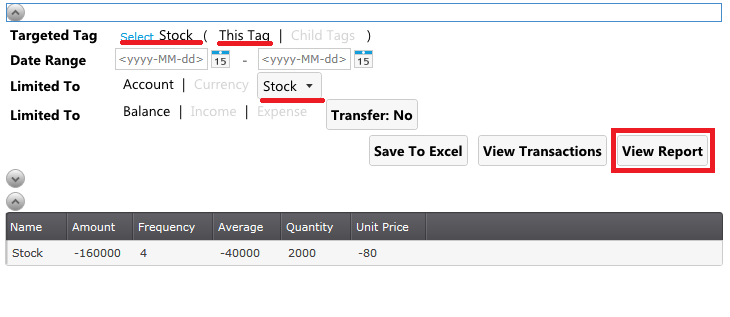
If we choose "This Tag", we will get the total amount instead of listing each company:
Let's try to sell some of the stocks to find more about what this feature can offer. Assuming we sold all 500 Microsoft shares at $80 per share, exactly the amount of money we spent. We sold 300 shares of Intel at $150 per share, earn $5000 and still have 200 shares. Sold 200 shares of IBM at $30 per share, 100 of Apple at $100 per share.
Notice that the quantity is negative and the amount is positive, indicating that we are selling quantities of items for money.
Click refresh on the account summary, we should be able to see the balance updated:
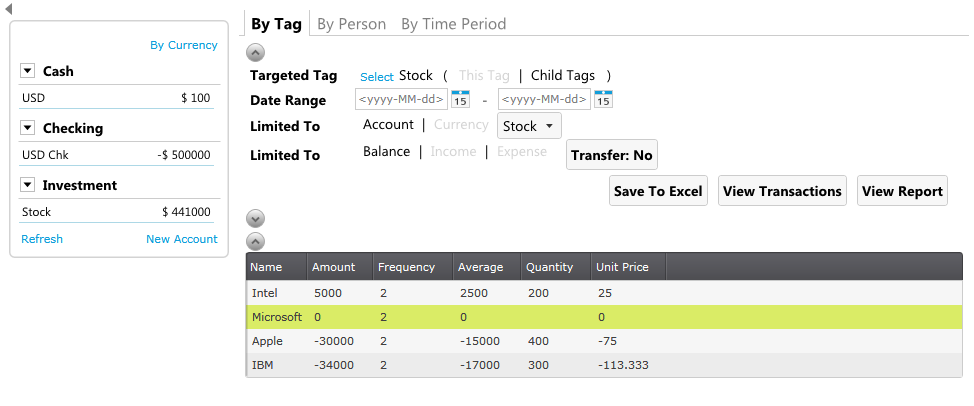
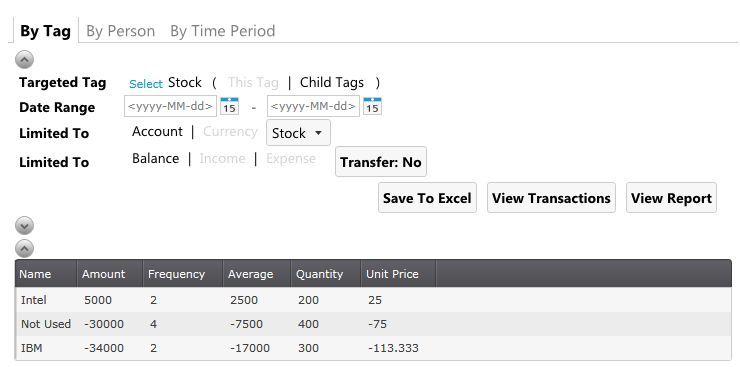
Let's try to use reports to find out the new stock details using the same setting. We can easily find out that we've earnt $5000 on Intel, $0 on Microsoft. For Apple, we need to sell the remaining 400 shares at $75 to break even, for IBM, we need to sell the remaining 300 shares at $113.33 per share to break even:
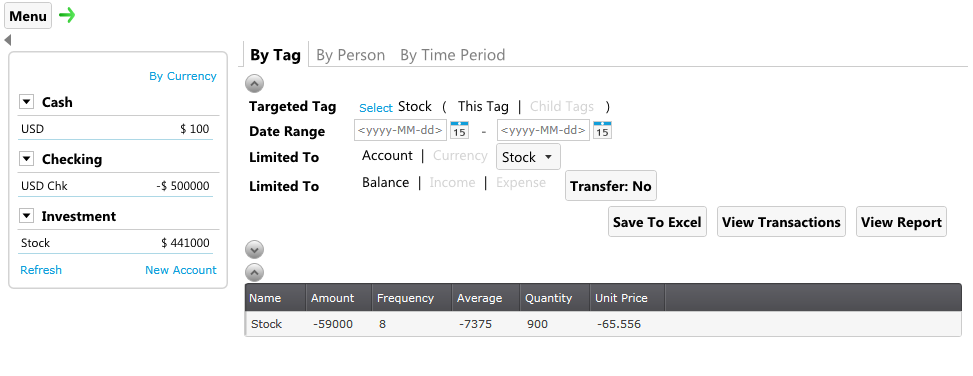
If we choose "This Tag", we will get the a summary of amount and number of shares:
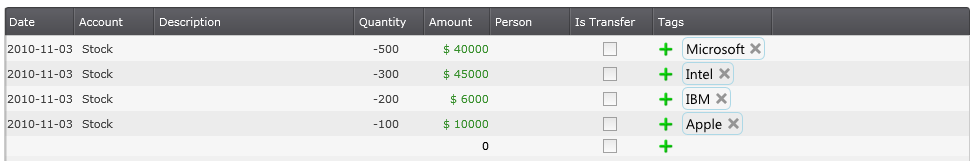
On the the previous two report screen, doesn't matter whether it's "This Tag" report, or "Child Tag" report, Click view transactions:
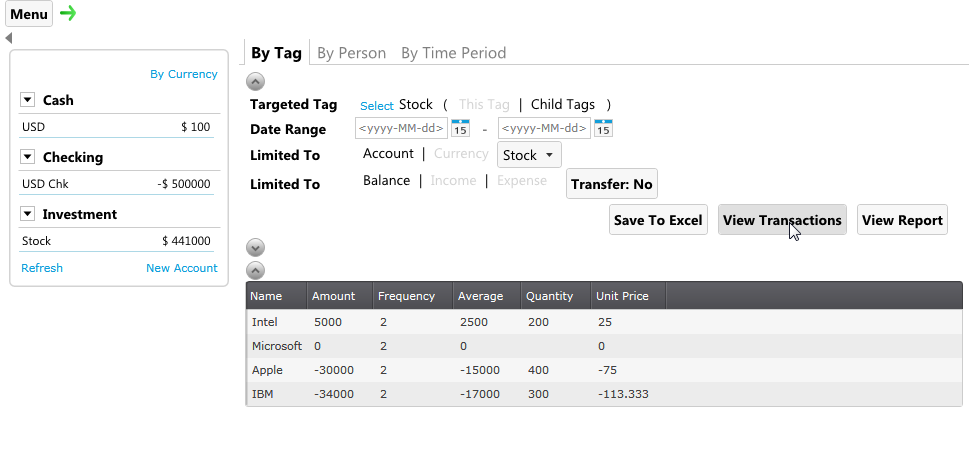
We will get all the buying and selling transactions associated with the report:
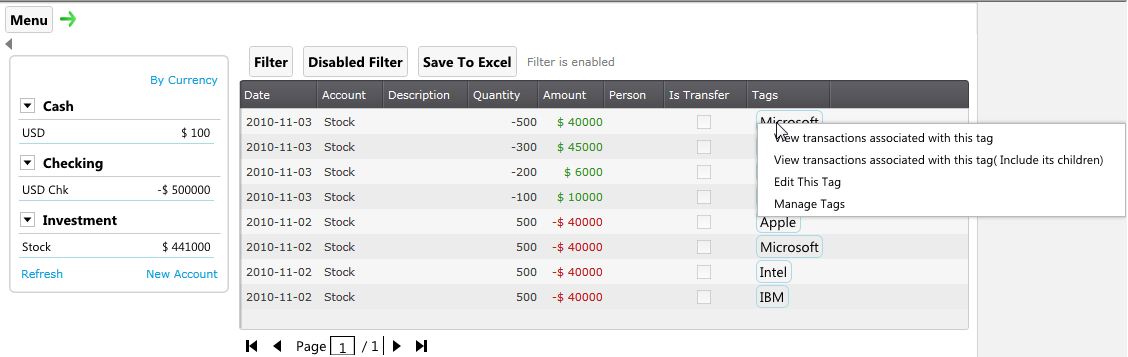
We can right click on the tag, for example Microsoft in this case, and choose "View transactions associated with this tag":
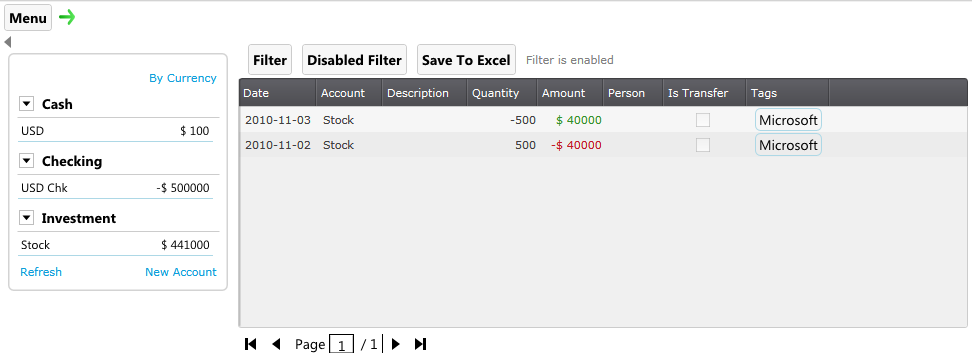
We will get the transactions related to buying and selling of Microsoft stocks:
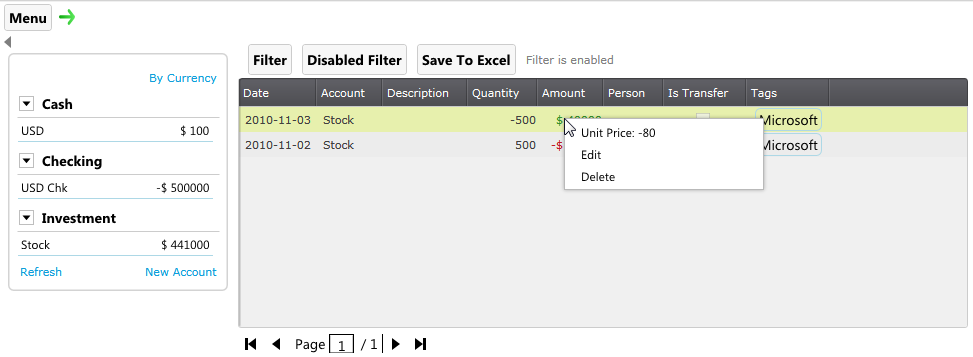
Furthermore, if we right click on the amount or quantity, we will get the unit price for that transaction, so we will know the price we bought it at that time:
Note that we can always use filter in transaction list to achieve the same result instead of viewing transactions from report.
Other thoughts?
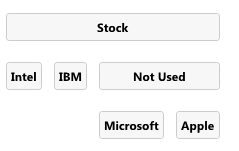
Notice in the report, it will list all the companies that we have ever bought and sold. As the list gets longer, it will be harder to manage. In the case, we can create another level of tags that will host some of the companies. For example, if we decide to not buy and sell Microsoft's and Apple's stock anymore. We can create a "Not Used" tag, and put those two companies into it. As shown below:
If we select "Not Used" for tag report, we will get the details for Microsoft and Apple. However if we select "Stock" as the targeted tag like we've done previously, notice the "Not Used" is replacing Microsoft and Apple, and the total amount and quantity is automatically calcuated:
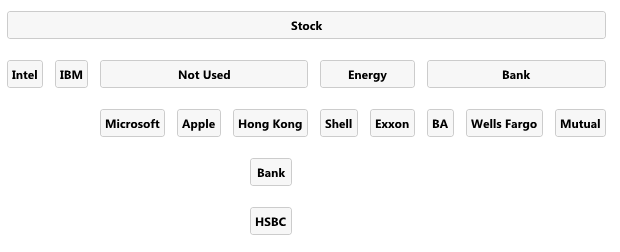
Multi-level tagging is so powerful that user can easily customize the tags to better manage lists or items. The possibility is unlimited:
The same concept can apply to inventory to track buying and selling of inventory. We hope that this simple example will help user to extend the usability of this free service provided by AccPal.com. Please feel free to contact us if you have any questions.